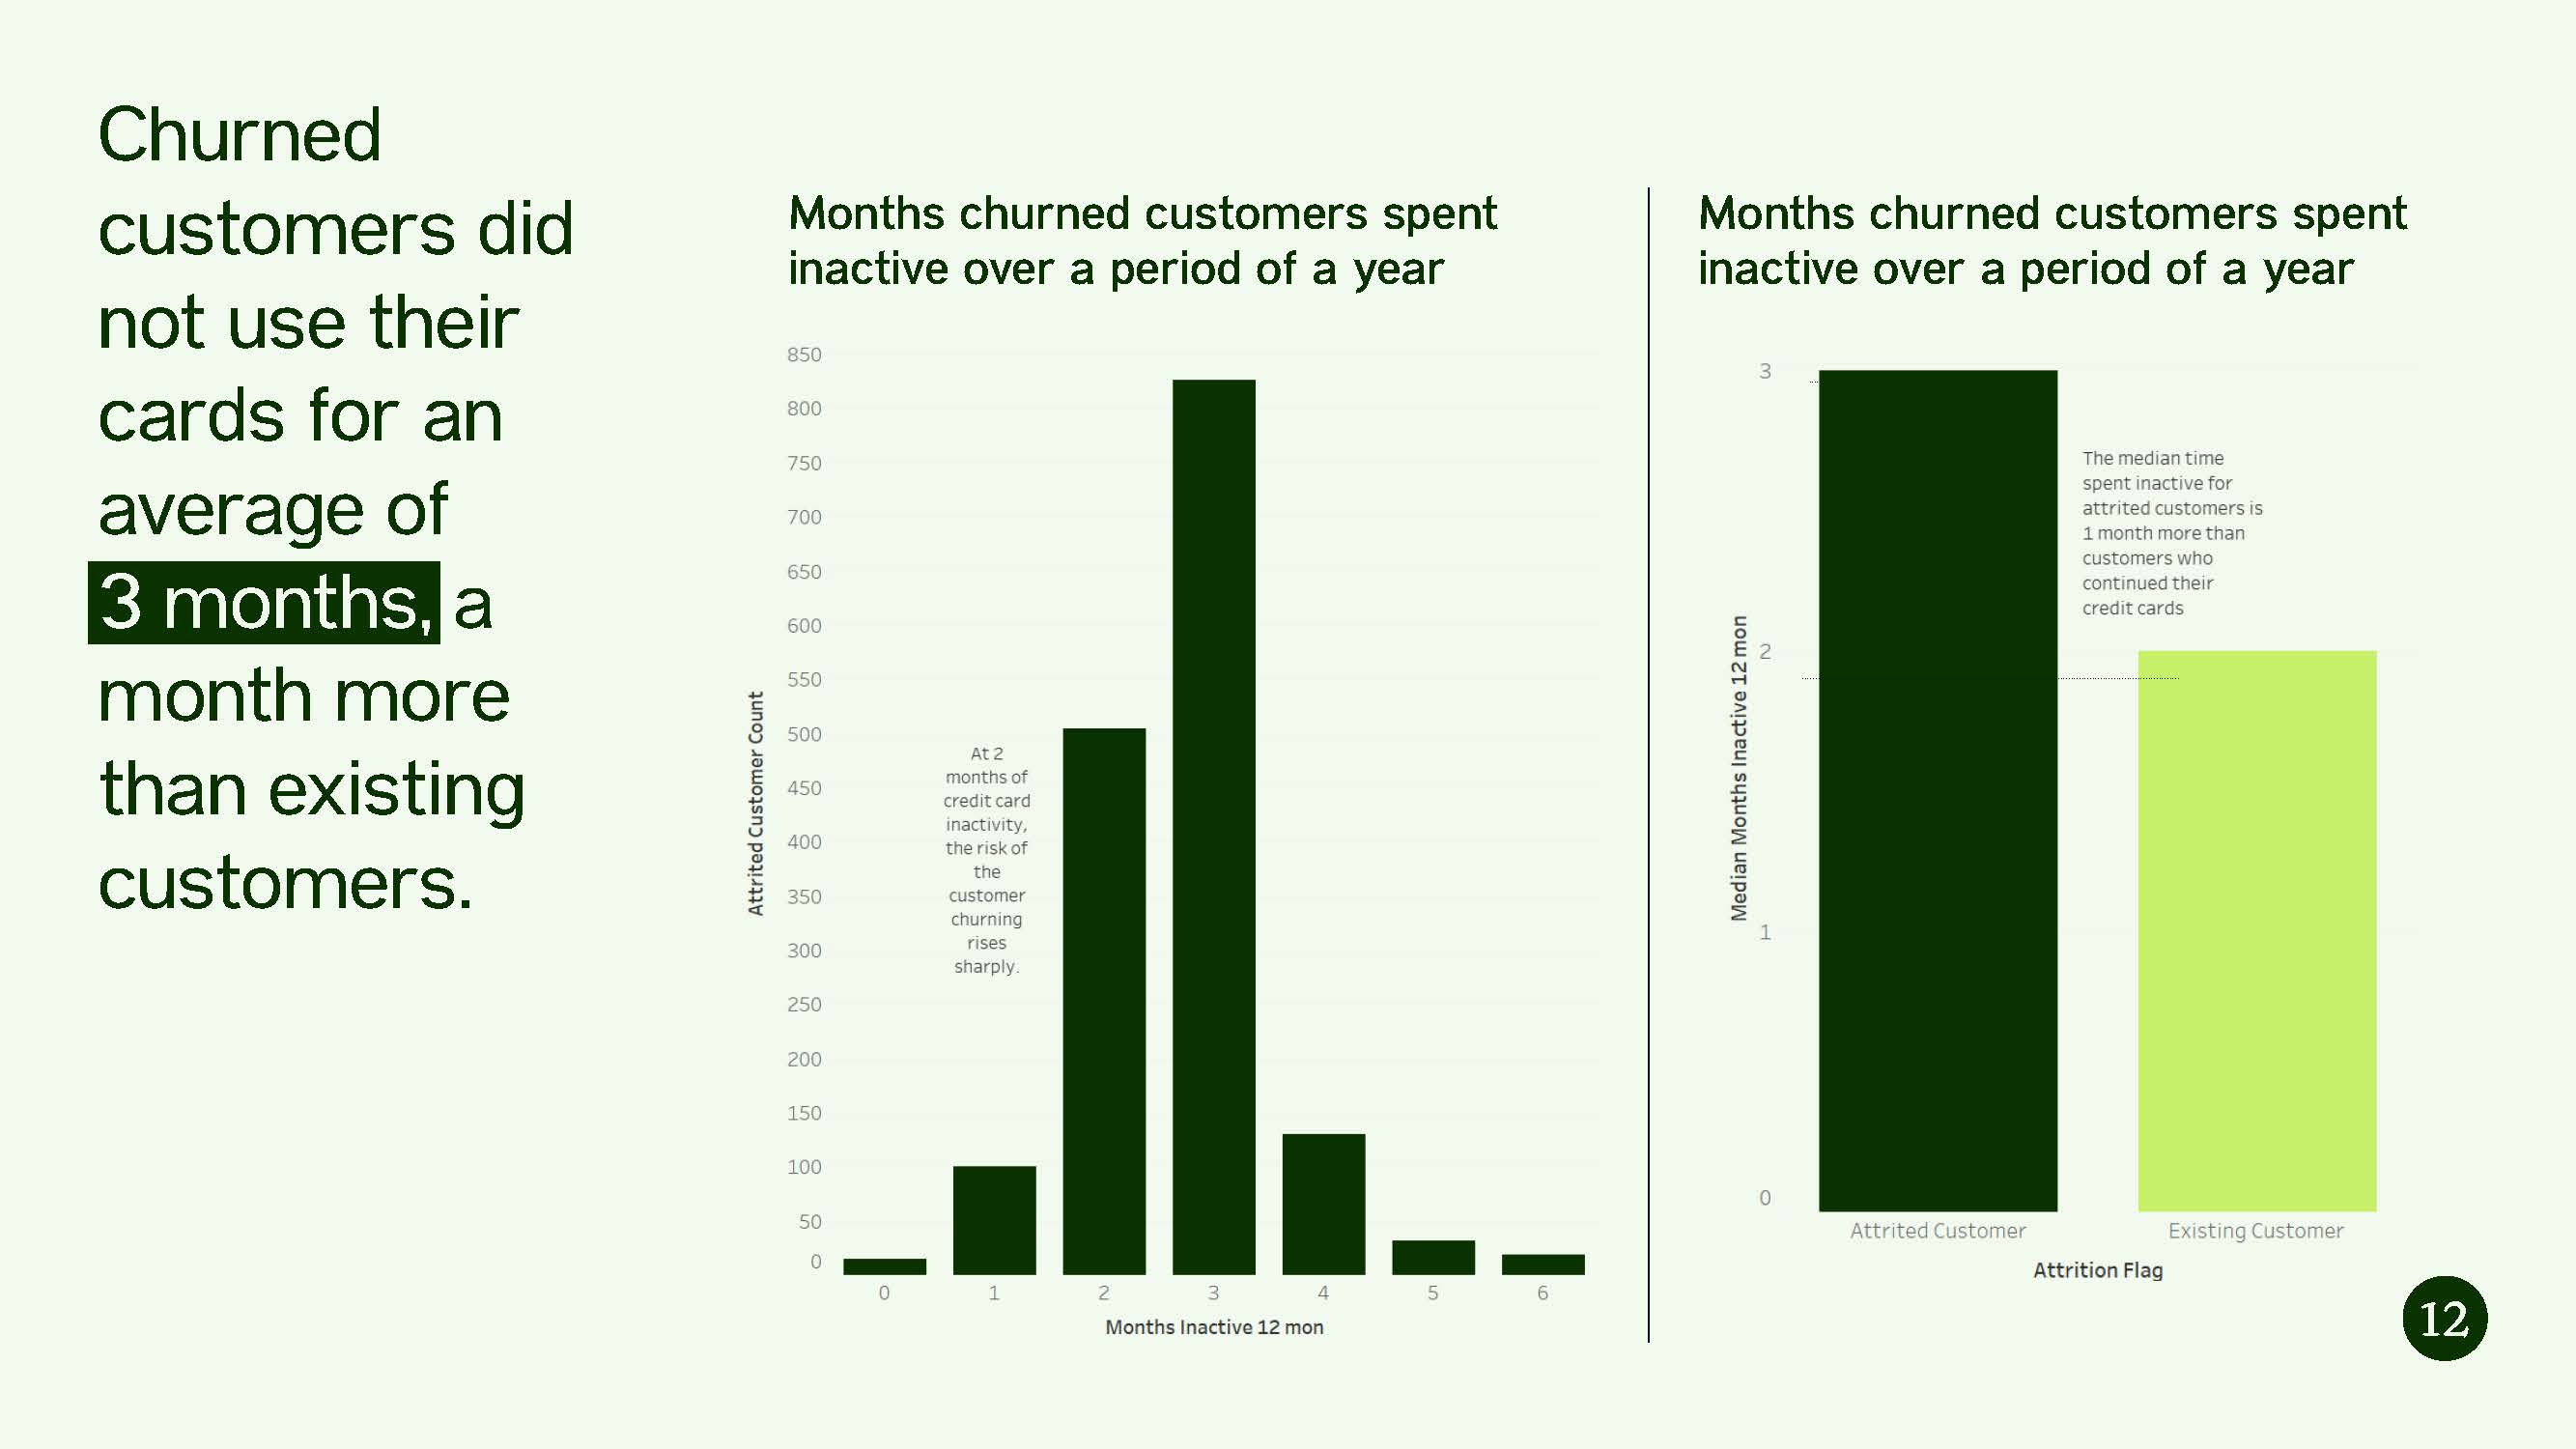
Data Bootcamp Capstone Project: Credit card attrition
This case study was created in Tableau for the capstone project for the Vertical Institute Data Analysis Bootcamp. It was my first time learning to use SQL, Excel and Tableau to analyse data and create charts.
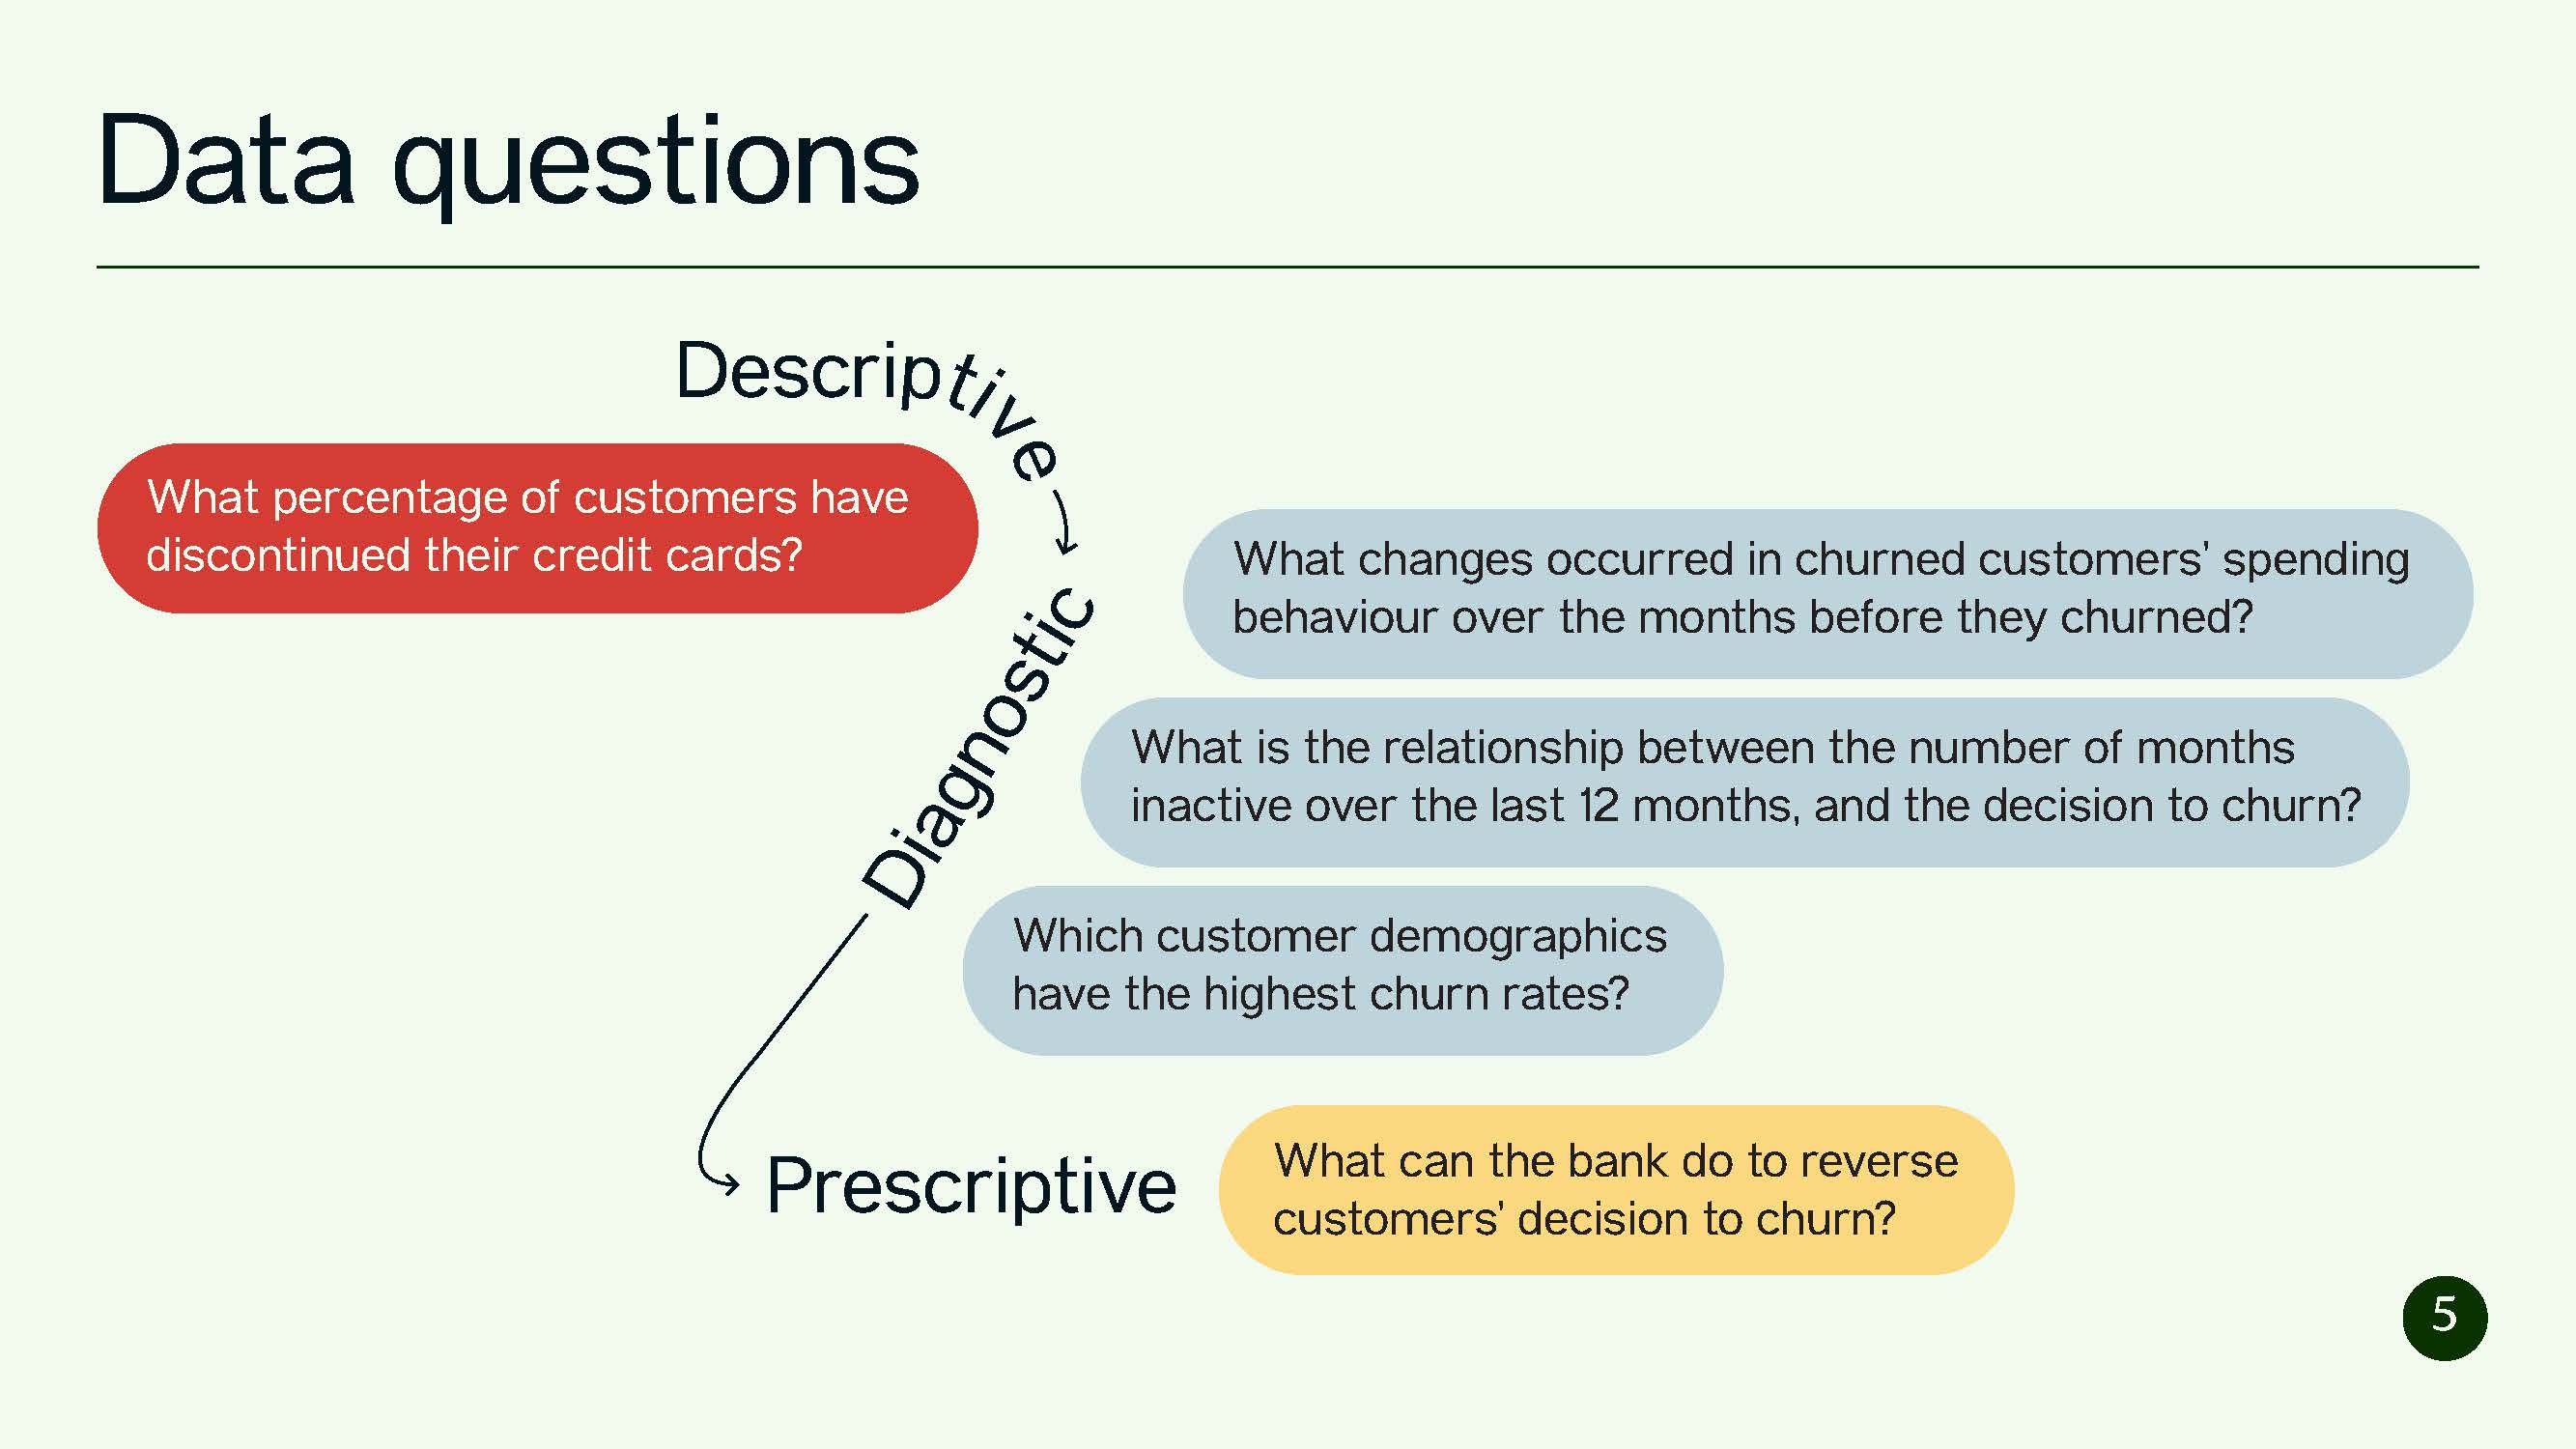
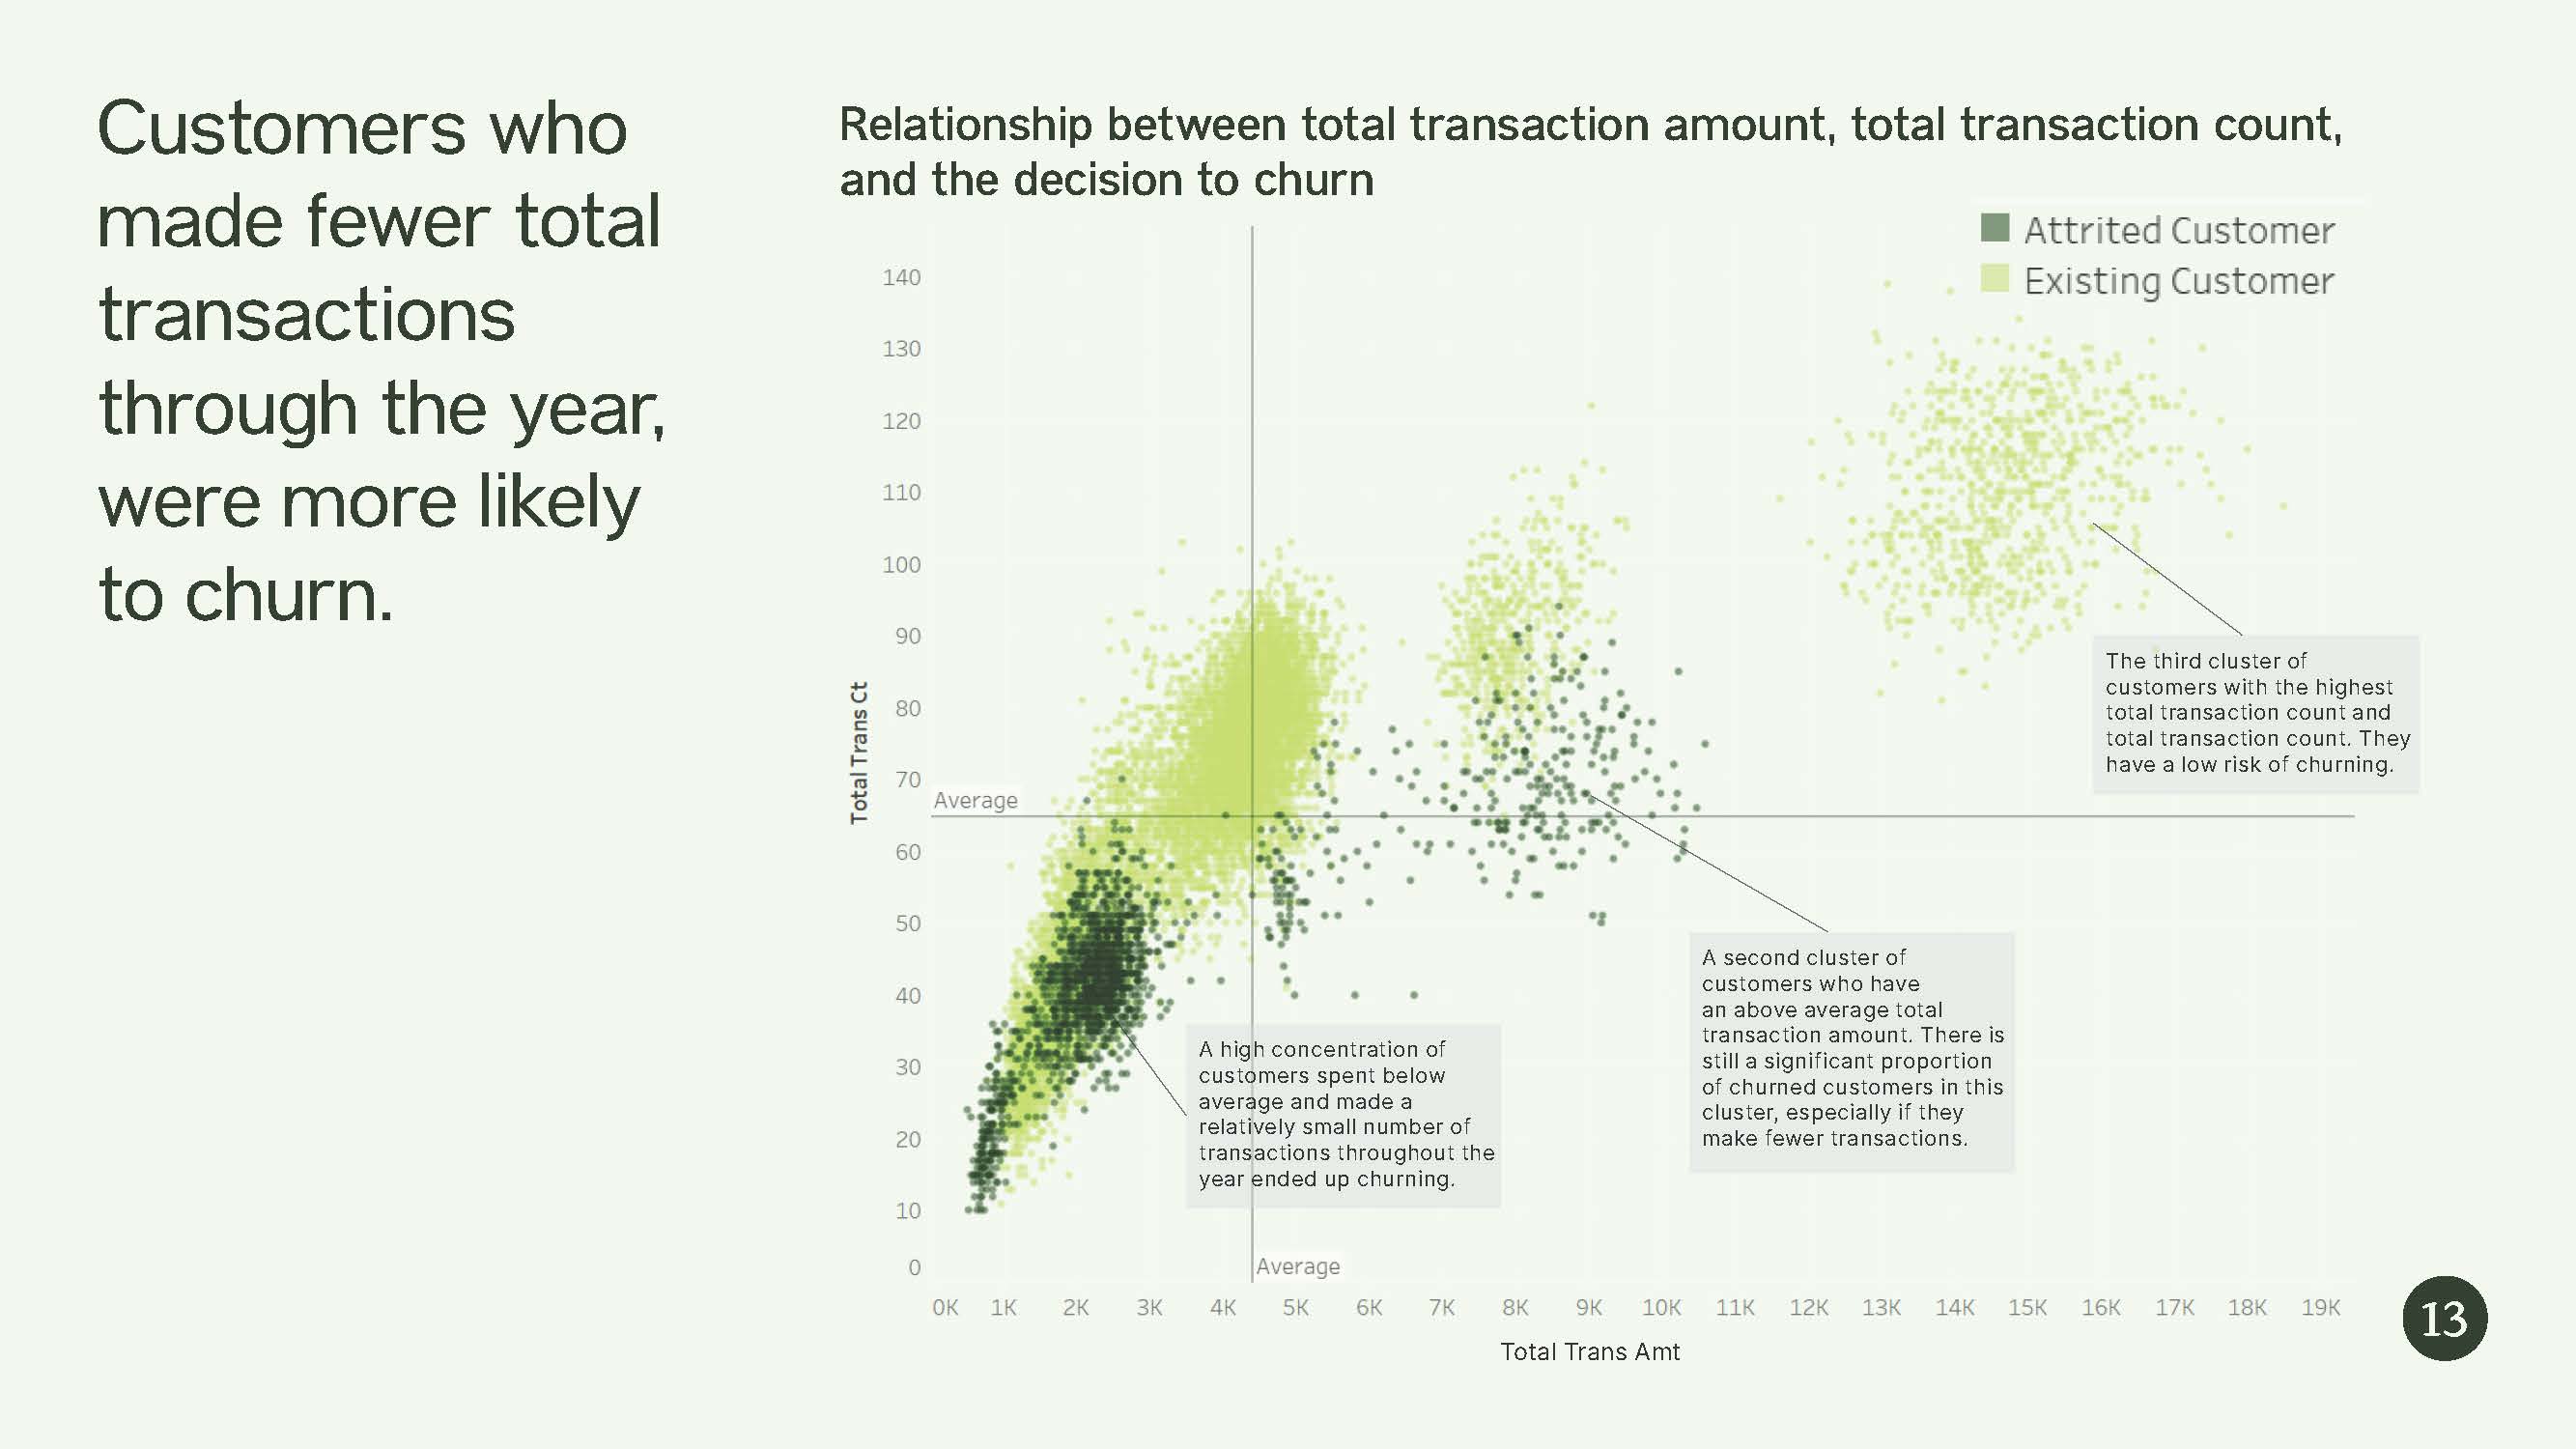
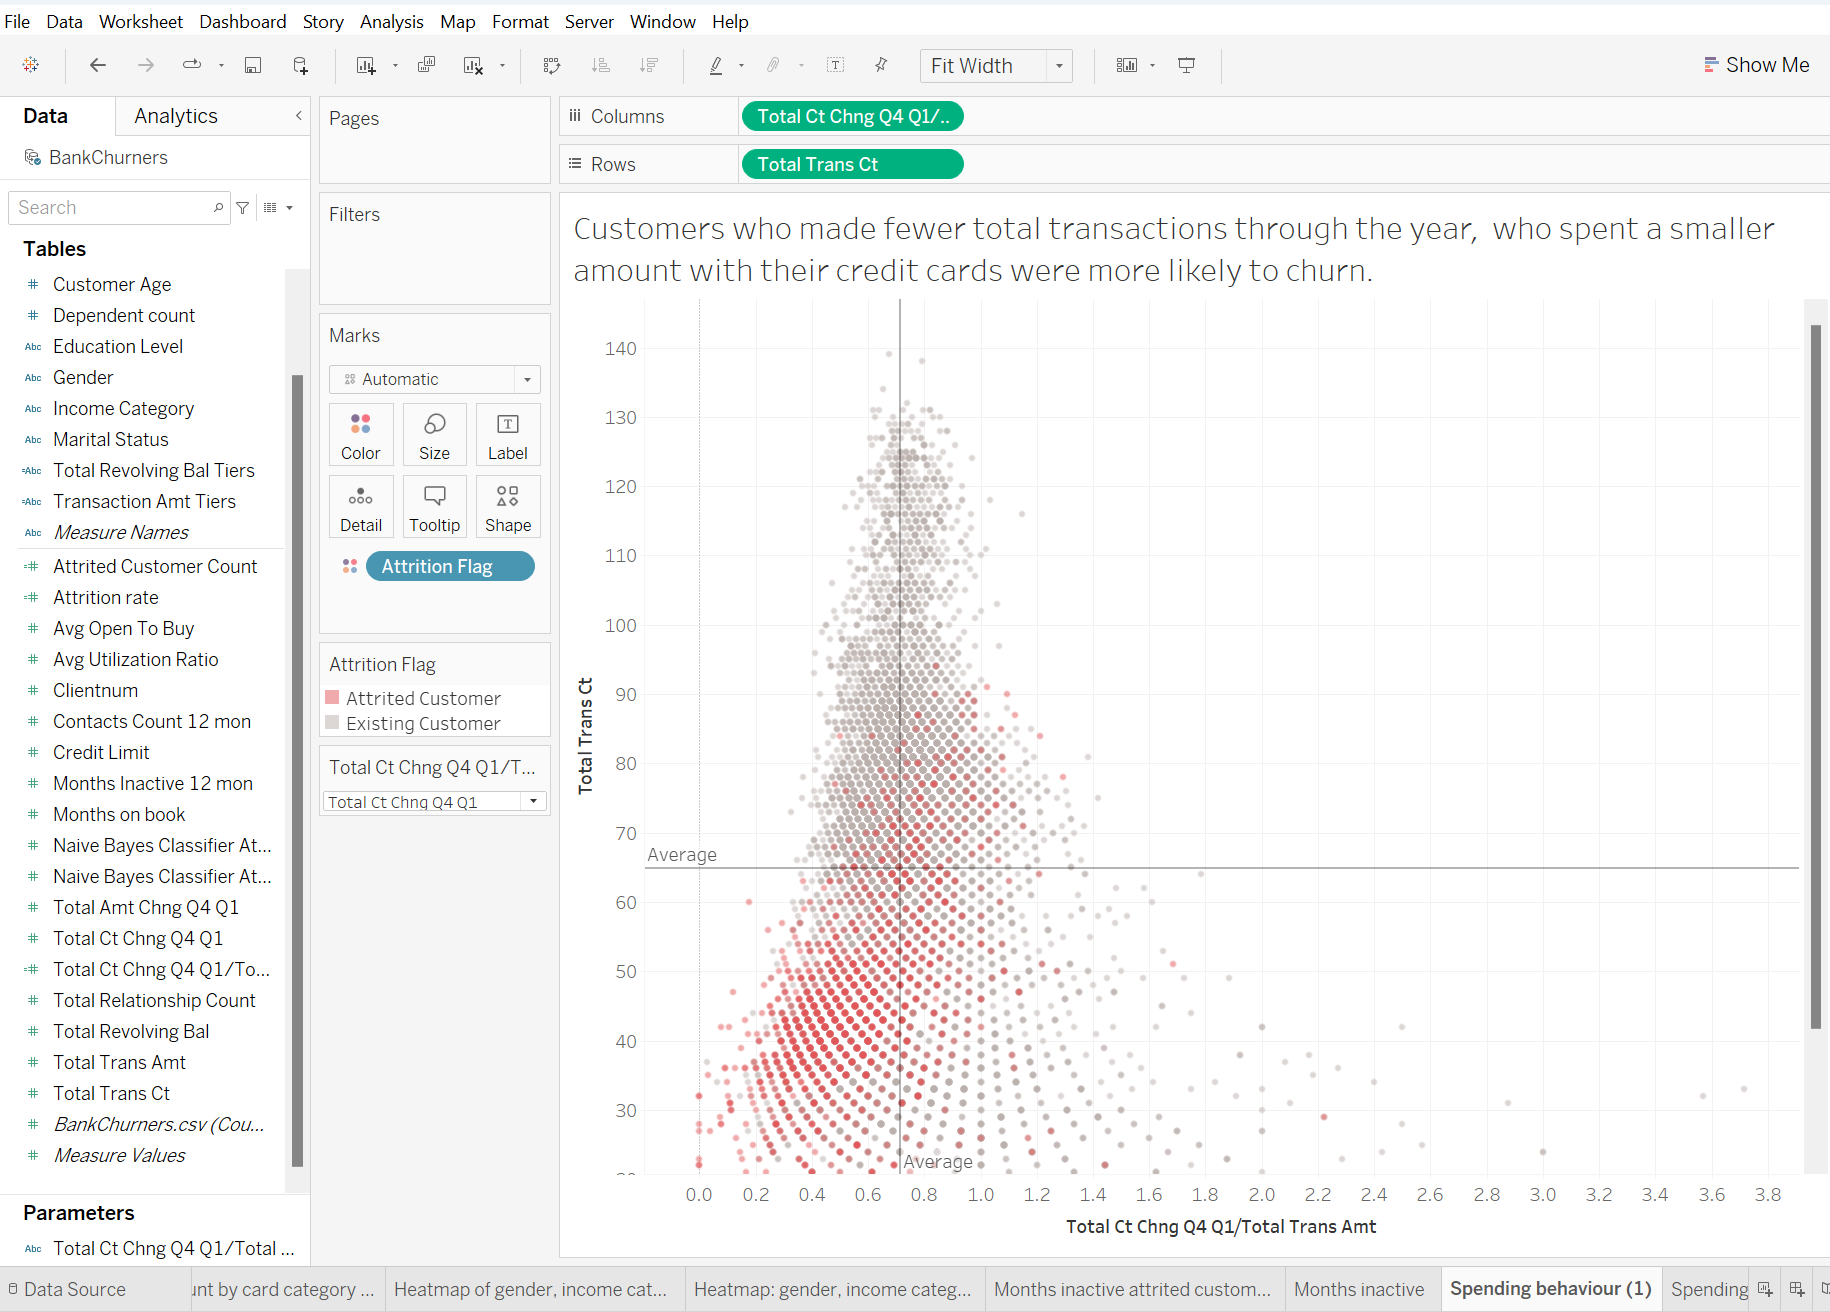
I made scatterplots from the dataset based on customer behaviour variables such as transaction count and change in transaction count over the months, to find indicators of early transition.
Course provider
Vertical Institute
Instructor
Lindsay Sunhendra Jap
Data